Dubai International Airport Passenger Traffic: Stata Statistical Software & Economena Analytics
The Middle East and North Africa (MENA) region suffers from both, data availability and data quality. Any effort to collect, clean and present data on the region is a welcome initiative.
Economena Analytics is doing just that. Economena collects data on many indicators in the MENA region and presents them in a way that is easily accessible for policy makers, researchers and academics. In this blog, we extract data on Dubai International Airport passenger traffic from the Economena Analytics Online Databases to illustrate Stata’s graphics abilities.
The data we have is monthly numbers of passengers at Dubai International Airport divided into three main categories: arriving passengers, departing passengers and transit passengers all in thousands. We limit the data from January 2000 to December 2014. We then use the year() and month() functions to separate the month and year from the date variable downloaded. We now have two new variables that identify the month and year of each observation. This is helpful if I want to perform any analysis specific to a month or year (for instance collapsing by a certain month or year).
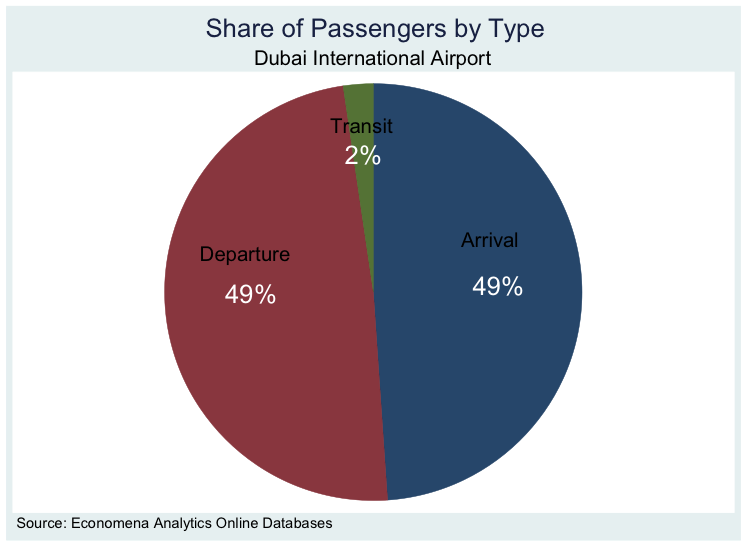
We will first create a pie graph that shows the share of each type of passenger from the overall number of passengers. The pie graph is below and tells us that transit passengers only account for 2% of the total number of passengers at Dubai International Airport. Both departing and arriving passengers make up an equal 49% share of the total number of passengers. Note here that I intentionally added the shares to the graph in white while keeping the labels in black. I could have changed both colours to match each other or to any different colour. The same applies to the colours of the slices. We could have also separated the slices from each other.

We now move to the second graph which is a line plot graph with connected lines. In this graph, We show three data series: the mean share of arrivals, departures and transit passengers by year. To get the mean shares We used the collapse command in Stata. The blue and dark red lines represent the arrivals and departures and the left hand y-axis should be used to read their values. The green line represents the transit passengers and the right hand y-axis should be used to read its values.

The graph says that in 2000, transit passengers were around 10% of the total passenger traffic at Dubai International Airport but this share has decreased all the way to less than 1% starting in 2012. On the other side, arrivals and departures have consistently increased over the first 14 years of the 3rd millennium going from around 45% in 2000 to almost 50% in 2014. Both of these suggest that Dubai is a destination city rather than a transit city.
I have showed different symbols (circle, triangle and square) for the lines, using the msymbol() function in Stata, to allow easier reading of the graph in case it was printed in non-color format.
Finally, we also added a vertical dashed red line for year of the financial crisis (2008). The line shows a drop in the share of arrivals to Dubai between 2008 and 2009 of around 2.5%. The share of arrivals did recover increasing between 2009 reaching a new peak in 2012 (where we added another vertical dashed red line). The new peak in 2012 is slightly lower than that of 2008. Interestingly, the share of departures suddenly jumped between 2008 and 2009. Note here that We am talking about the share of arrivals and departures and not the number of passengers as arrivals or departures. To look at the total number of arrivals and departures it would be good to graphs these using dates. We suggest using the tsline command to plot time-series data.
The above exercise was a simple implementation of data management and Stata graphics using data from Economena Analytics. For the Stata dofile of this exercise click here. If you would like to learn more about how to deal with data in Stata, see the list of the upcoming Timberlake Stata courses.
George Naufal @georgenaufal